
![]()
|
|
|
|
|
|
|
|
|
A
comprehensive thermodynamic characterization of any single reaction is necessary
to fully appreciate its impact on a system involving coupled reactions. Isothermal titration
calorimetry (ITC) is now commonly used to study such reactions.
This is due in part to significant advances in
technology over the last few decades enabling the development of very accurate
calorimeters.
The increasing popularity of this technique is apparent
when considering the results of a literature search for the keyword ‘ITC’, which
shows a monotonic increase in publications over the last two decades.
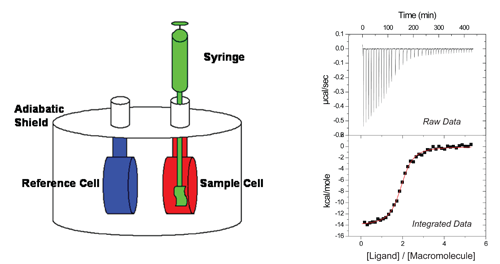
Current models of ITC instruments
consist of two identical coin-shaped Hastelloy® (or gold) cells, one being the sample cell
and the other the reference cell, connected via a thermocouple and surrounded by
an adiabatic jacket.
A heater is linked to each cell and a set amount of
power is delivered to each to maintain thermal equilibrium. The macromolecule of
interest is loaded into the sample cell while a solution of equal heat capacity,
commonly an identical buffer lacking the macromolecule, is loaded into the
reference cell.
The ligand of interest is then loaded in the
titration pipet and inserted into the sample cell.
Very small volumes of titrant, typically 2-10 µL,
are delivered to the sample cell.
As the reaction progresses, any difference in
temperature between the sample and reference cells is detected by the
thermocouple and the power delivered to the sample cell is adjusted accordingly
(raw data in figure).
The injection enthalpy is determined directly from
the raw data by integration of the power delivered to the cell with respect to
time followed by concentration normalization.
In a standard ITC experiment, a known concentration of
ligand is injected into the reaction cell containing a known concentration of
macromolecule.
The ensuing thermodynamic profile, describing the heat flow
over the course of the experiment, is fit to a mathematical model using
non-linear least-squares analysis.
Currently, there are several fitting models provided
with the ITC software.
·
One-site.
This is the simplest binding model.
It assumes that n ligands bind
per macromolecule with identical thermodynamics and the best-fit values of
n, the reaction stoichiometry, K and
ΔH are determined.
·
Two-site.
This model makes the assumption that there are two binding events that
occur with independent thermodynamics and the statistical saturation of each
site is dictated by the magnitude of the individual K values.
In this case, the best fit will generate
n, K and ΔH
for each site. It is a common
mistake to assume that n correlates
with the x-axis position of the inflection, but each
n value is independent of the other
for this model (i.e. n1 =
1 and n2 = 2 means one
ligand binds to site 1 while site 2 binds two ligands with equivalent
thermodynamics).
·
Sequential. This model requires
that the 1st ligand to bind to the macromolecule goes to the 1st
site, and the nth ligand to bind goes to the nth site.
The sequential saturation requisite excludes
n as a fitting parameter since a
non-integer value would make no physical sense.
For this reason, the accuracy of molecular concentrations is more
important for the sequential model, as n
is a soft parameter in the previous two models and can often correct for
inaccurate concentrations. A
benefit of this model is the smaller number of fitting parameters, which makes
it possible to obtain a unique fit for very convoluted data, assuming that each
site has significantly different K and/or ΔH
values. It is essential to keep in
mind that this model is not appropriate for independent sites where saturation
is dictated by individual binding constants.
·
Competition. Utilization of this model is appropriate for situations that
require the use of a competing ligand, for example when solubility is an issue
or KITC is too large to accurately fit in a direct titration.
In contrast to the competition experiments to be discussed in detail
later, this model assumes that the competing ligand is present only in the
syringe, and its apparent concentration is calculated throughout the titration.
Anytime experimental data is fit to a mathematical model, there is an optimal
range of values that maximize confidence in the fit parameters.
For ITC, this range is known as the
c-window, 1 <
c < 1000
, where c is defined numerically
by
c = n•KITC•[Macromolecule]
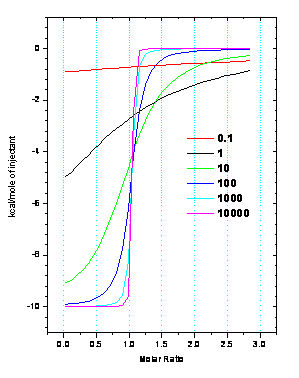
As depicted in the figure, when
c grows too large, the resulting ITC
data takes on the shape of a step function and can be fit to any KITC
~ 109, although accurate ΔH
data can be obtained. When c is too
small, the data represents a featureless curve and can be fit to multiple n, K
and ΔH values.
In many cases, ITC experiments are straightforward to design and data
analysis is possible using the fitting models above with no further
complications. This is generally
not the case when one of the species of interest is a metal ion.
In these situations, significant speciation is likely, resulting in
additional experimental considerations and necessitating a more rigorous
post-fit analysis to accurately account for all coupled equilibria.
This is of particular interest for our lab and is detailed
here (or more consicely
here).
![]()