Name:_______________________________ Course:____________ Date/Time:____________
Partner(s):_____________________________________________________________________
Purpose:
Apparatus: Three resistors, 3 capacitors, circuit board, digital multimeter, and 2-banana plug wires w/alligator clip on one end.
A. Resistors:
1. Determine the values of the three resistors using the resistor color code.
2. Measure the values of the three resistors using the digital multimeter (DMM).
|
R1 |
R2 |
R3 | |
| From resistor color code | |||
| From digital multi- meter | |||
| Tolerance |
3. When two or more resistances are connected in series the equivalent resistance, R is give by;
![]()
When two or more resistances are connected in parallel the equivalent resistance, R is give by;
![]()
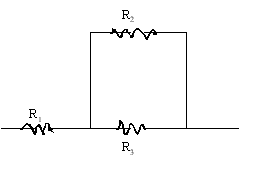
Connect the three resistors as shown below and measure the equivalent resistance.
|
Resistor combination |
Resistance values | |
| Measured | Calculated | |
| All in series |
| |
| All in parallel |
| |
 |
||
 |
||
 |
||
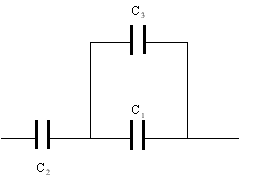
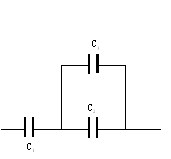
B. Capacitors:
When two or more capacitors are connected in series the equivalent capacitance, C is give by;
![]()
When two or more capacitors are connected in parallel the equivalent capacitance, C is give by;
![]() Measured values: C1= _______
C2=_______ C3=_______
Measured values: C1= _______
C2=_______ C3=_______
|
Capacitor combination |
Capacitance values | |
| Measured | Calculated | |
| All in series |
| |
| All in parallel |
| |
 |
||
 |
||
 |
||
C. Resistivity:
Purpose: To investigate the resistance of metal wires using a digital multi meter.
Apparatus: DMM, metal wire: one long and two short, connector box, micrometer, and meter stick.
Theory: Resistance, R of a metal wire of length l and cross-sectional area A is given by:
![]()
Procedure:
1. Set the DMM to measure resistances and connect two banana-plug wires from it to the connector box.
2. Connect one end of the long metal wire to one of the terminals of the connector box.
3. Measure 10 cm length of wire, (do not cut the wire) and connect it to the other terminal so that there is exactly 10 cm of wire between the terminals.
4. Record the resistance value and repeat 3 for other lengths.
5. Plot a graph R versus length, and determine its slope.
6. Measure the diameter of the wire with a micrometer and calculate the resistivity of the metal.
DATA
| Length of metal wire, l | Resistance of metal wire, R |
Slope of R versus l, graph:_________________
Diameter of wire = __________________ Cross-Sectional area of wire =________________
Resistivity of wire = _________________
Now that you have seen what happens to the resistance as the length increases, can you predict what will happen to the resistance as the diameter increases?
PREDICTION:_________________________________________________________________
______________________________________________________________________________
You can check your prediction for the effect of diameter, by doing the following investigation, for a thin and thick wire of equal length:
Measure the resistance of the thin wire. Then measure the resistance of the thick wire.
|
Wire Type |
Resistance |
|
thin wire |
- |
|
thick wire |
- |
EXPLAIN YOUR RESULTS:______________________________________________________
______________________________________________________________________________
______________________________________________________________________________
Question: Electricity is transported across states using power lines with thick wires. Explain why?
______________________________________________________________________________
______________________________________________________________________________
______________________________________________________________________________
Include the following in your conclusion:
a. How does the length of wire affect the resistance of the wire and why?
b. How does the diameter of wire affect the resistance of the wire and why?
c. What information of the metal wire is provided by the slope of the R Vs. l, graph?